Dashboards are an easy and pre-built way to capture important statistics relative to you and your organization.
Below are the guidelines for Dashboards:
- The organizational Report permission controls access to each module's dashboard.
- Dashboards by default display the LMS data but users can toggle to the desired module
- If you are a supervisor of users, you may select the "People I Supervise" option. This option is for LMS only.
- All dashboard statistics are dynamic and will automatically be updated.
- On all graph charts you may hover over or click statistic for more information or the square box (year, stage, etc.) to filter information.
Below are the optional drop-down filters for LMS dashboards:
- Myself: Select this option to view your users' statistics only.
- People I Supervise: Select this option to view the statistics of your supervisees.
- Company: Select your organization if you are part. Typically, only one company will be displayed
- Division: Select a division from the list to filter the displayed information by location.
- Filter by Date: Select the date range by year of information you are looking for
- Custom Range: this option will allow you to filter on months and days.
Below are the quick dashboard statistics:
Default filter is YTD (Year to Date)
- Completed Training Items: Total number of training items completed.
- Overdue Training Items: Total number of training items that are past the due date.
- Training Items Currently on Learners Desktops: Total number of training items on learners' desktops. By default, their due date would be within 60days of today's date.
- Will not display if filtering on "Myself".
- Training Hours Completed: Total number of hours your learners have spent taking training.
Below are the dashboard graph charts:
Below are the dashboards that will be displayed by default after selecting "LMS" or filtering by "Company". Based on the above filters applied the dashboard charts will be updated, scroll to the desired chart.
Default/Company Level
- Training Completed per Division
- This chart will display the number of training items completed organized by Division. By hovering over the respective bar, the data will be formatted as [Division: Number of Trainings].
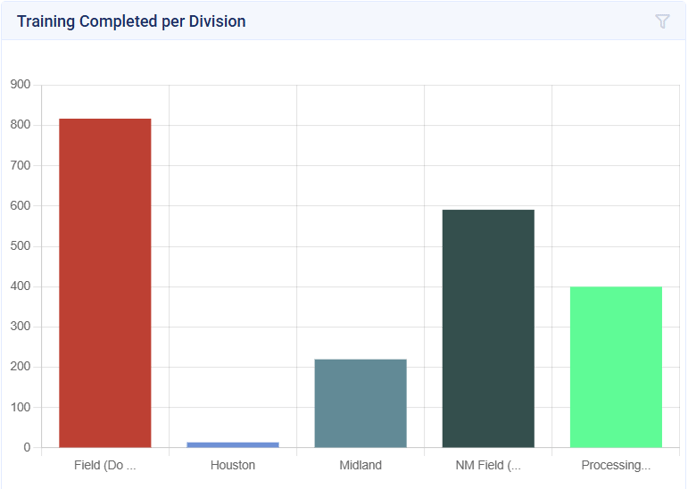
This can be filtered by Division if desired.
- Training Completed per Subject Area Code
- This chart will display the number of training items completed organized by Subject Area Code. By hovering over the respective bar, the data will be formatted as [Subject Area Code: Number of Trainings].

This can be filtered by Subject Area Code if desired.
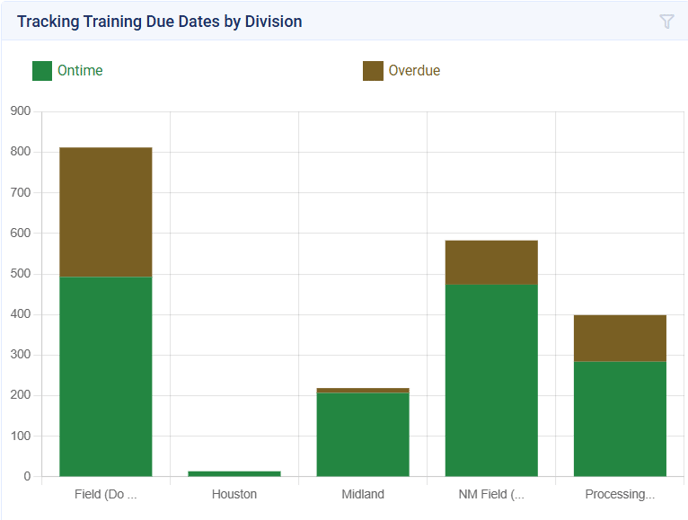
- Tracking Training Due Dates By Division
- This chart will display the number of training items which are Ontime vs Overdue organized by division. By hovering over the respective division, the data will be formatted as [Division: Number of Training Items].
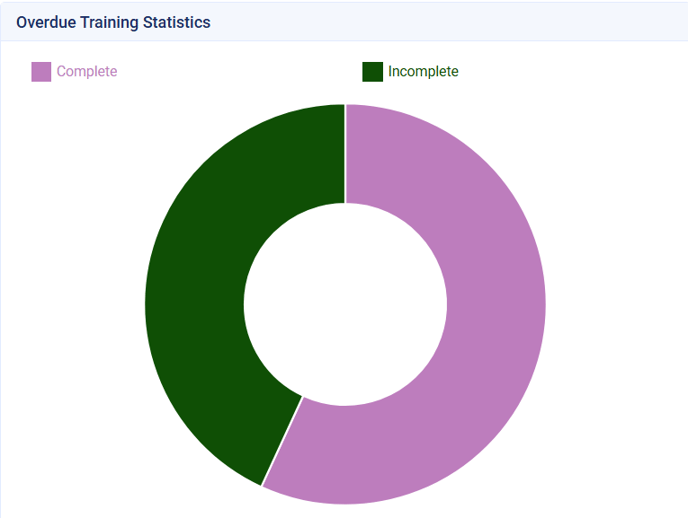
- Overdue Training Statistics
- This chart will display the percentage of overdue training items which are complete vs incomplete. By hovering over the respective color, the data will be formatted as [Status: %].
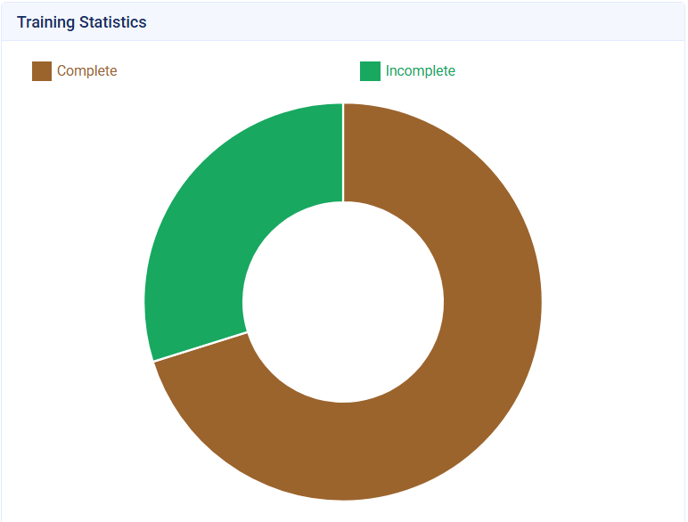
- Training Statistics
- This chart will display the percentage of training items which are complete vs incomplete. By hovering over the respective color, the data will be formatted as [Status: %].
Division Level
- Training Completed per Account
- This chart will display the number of training items completed organized by Account. By hovering over the respective bar, the data will be formatted as [Account: Number of Trainings].

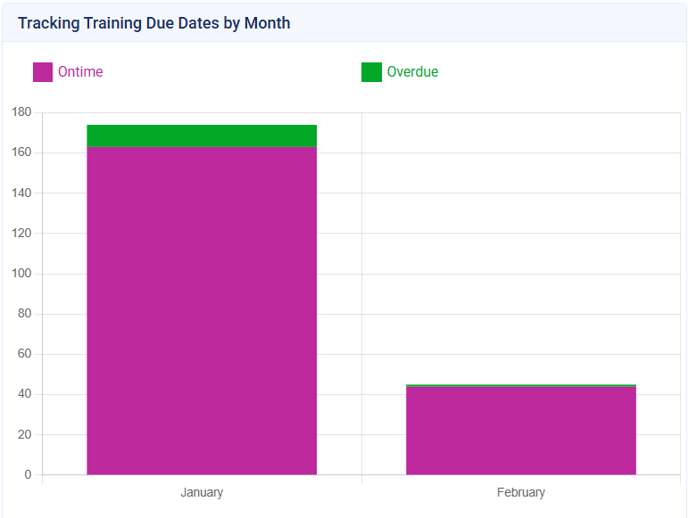
- Tracking Training Due Dates by Months
- This chart will display the number of training items that are overdue vs on time organized by month. By hovering over a respective bar, the data will be formatted as: [Months: Number of training items].