Dashboards are an easy and pre-built way to capture important statistics relative to you and your organization.
Below are the guidelines for Dashboards:
- The organizational Report permission controls access to each module's dashboard.
- Dashboards by default display the LMS data but users can toggle to the desired module
- If you are a supervisor of users, you may select the "People I Supervise" option. This option is for LMS only.
- All dashboard statistics are dynamic and will automatically be updated.
- On all graph charts you may hover over or click statistic for more information or the square box (year, stage, etc.) to filter information.
Below are the optional drop-down filters for Event dashboard:
- Company: Select your organization if you are part. Typically, only one company will be displayed
- Division: Select a division from the list to filter the displayed information by location.
- Filter by Date: Select the date range by year of information you are looking for
- Custom Range: this option will allow you to filter on months and days.
Below are the quick dashboard statistics:
- In Process Events: Number of Events located in your ACT > In Process Folder.
- Events Past Expected Completion Date: Number of Events that are overdue, and have gone past the expected completion date.
- Inbox Event Action Items: Number of Action items currently awaiting action on users' desktops.
- Overdue Event Action Items: Number of open action items that have gone past the due date/ days to complete.
- Events Ready for Close-Out: Number of Events ready for the Event to be closed (completed) by the Team Leader.
- Send Notices Awaiting Sign Off: Total number of Send Notices that are awaiting action as Training Items on the assignee's desktop.
Below are the dashboard graph charts:
Below are the dashboards that will be displayed by default after selecting "Events" or filtering by "Company". Based on the above filters applied the dashboard charts will be updated, scroll to the desired chart.
Default/Company Level
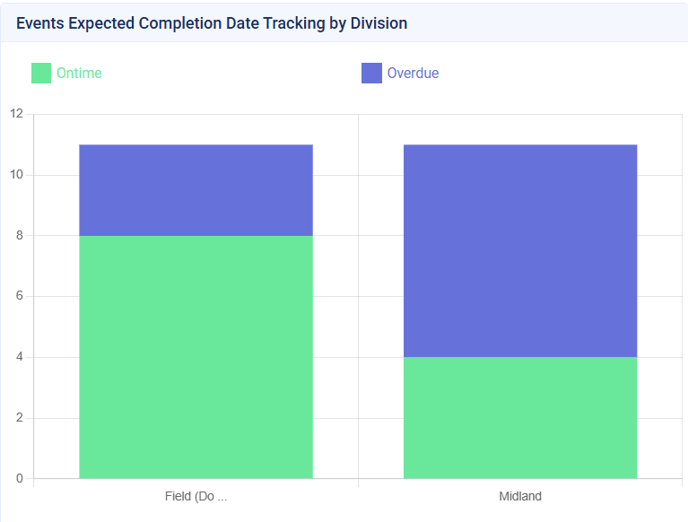
- Events Expected Completion Date Tracking by Division
- This chart will display the quick statistic "Events Past Expected Completion Date" in more detail by showing the number of Events which are Ontime vs Overdue for all divisions. By hovering over the respective Division, the data will be formatted as [Status: Number of Events]
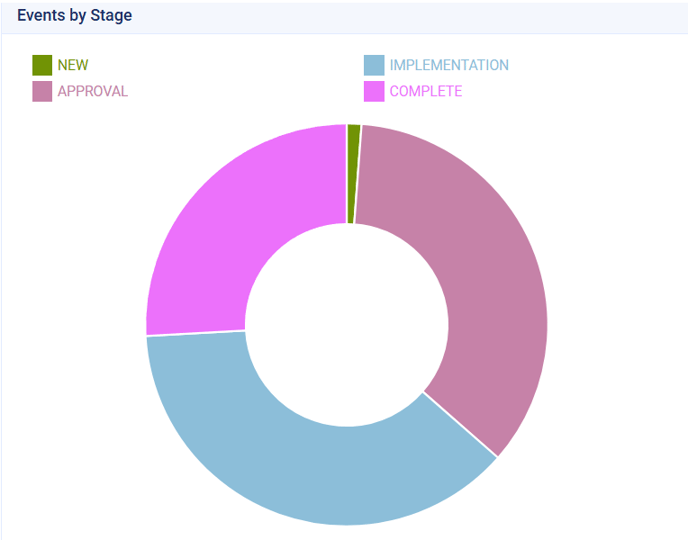
- Events by Stage
- This chart will display the Events grouped by stage. By hovering over the respective stage, the data will be formatted as [Stage: Percentage %]
- Events by Stage per Ref Code
- This chart will display the number of Events grouped by stage and their respective Ref Codes. By hovering over the respective bar, the data will be formatted as [Ref Code: Number of Events].
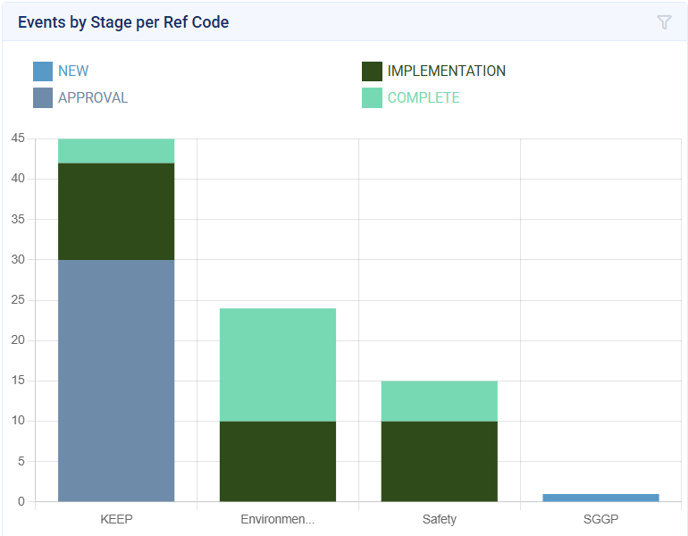
This can be filtered by Ref Code if desired.
- Events by Ref Code Per Division
- This chart will display the number of ref codes grouped by division. By hovering over the respective bar, the data will be formatted as [Ref Code: Number of Events]
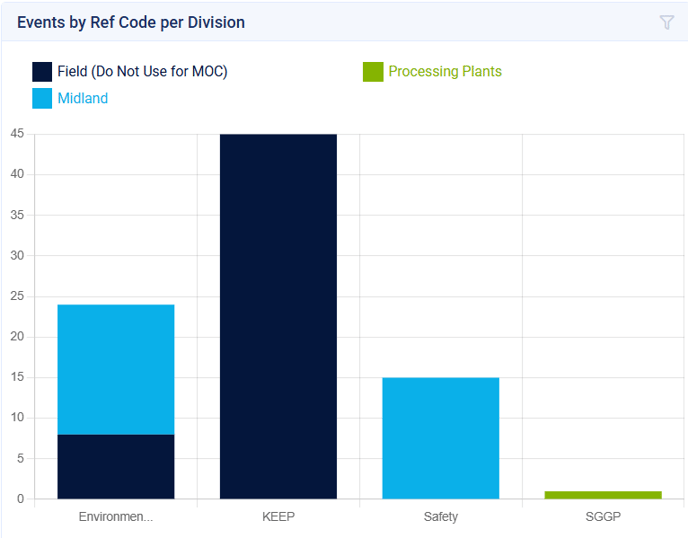
This can be filtered by Ref Code if desired.
- Events By Priority per Division
- This chart will display the number of Priorities grouped by division. By hovering over the respective bar, the data will be formatted as [Priority: Number of Events]
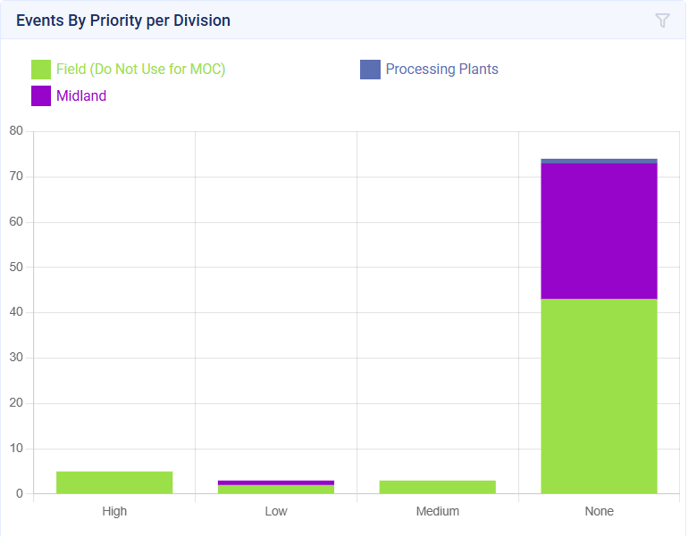
This can be filtered by Priority if desired.
- Events by Category per division
- This chart will display the number of Categories grouped by Division. By hovering over the respective bar, the data will be formatted as [Category: Number of Events].
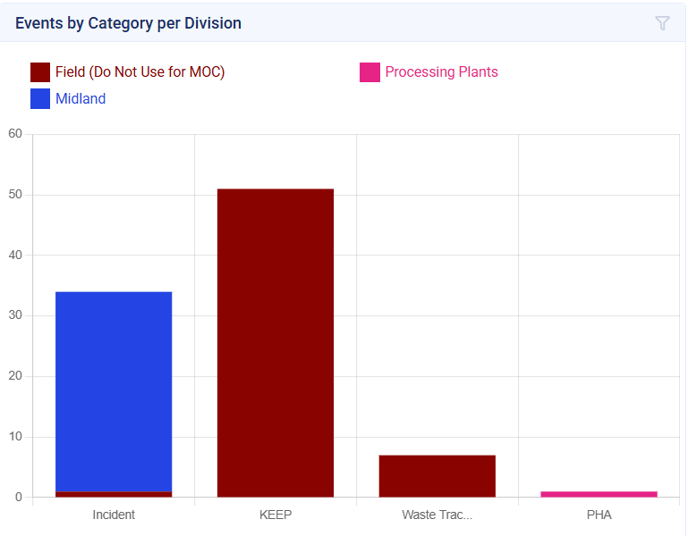
This can be filtered by Category if desired
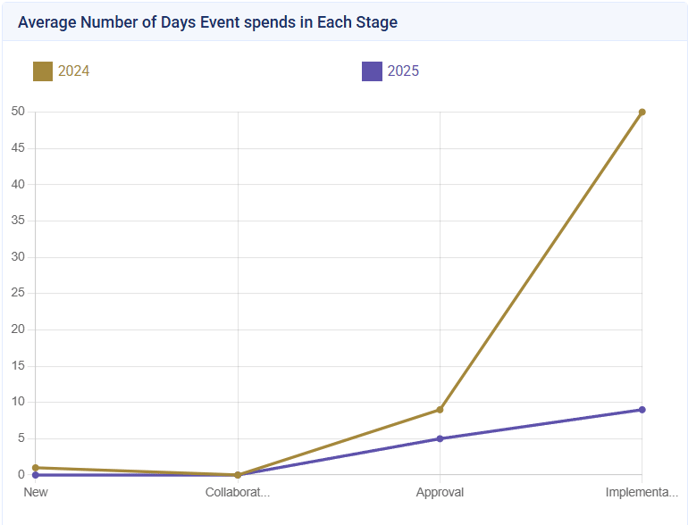
- Average Number of Days Event spends in Each Stage
- This chart will display the number of days your companies Events are spending in each stage of the Event workflow. By hovering over the respective bar, the data will be formatted as [Stage: Number of Days.
Division Level
- Events by Ref Code Per Account
- This chart will display the number of ref codes grouped by Account. By hovering over the respective bar, the data will be formatted as [Ref Code: Number of Events]

This can be filtered by Ref Code if desired
- Events By Priority per Account
- This chart will display the number of Priorities grouped by Account. By hovering over the respective bar, the data will be formatted as [Priority: Number of Events]
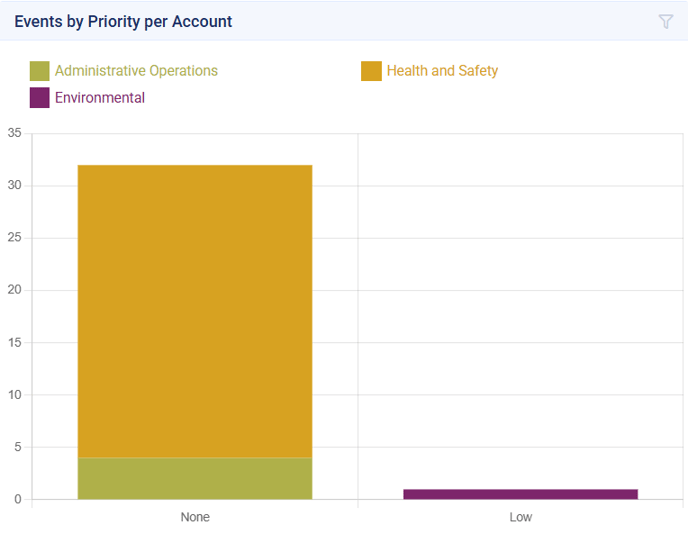
This can be filtered by Priority if desired.